User Feedback
.
User Feedback
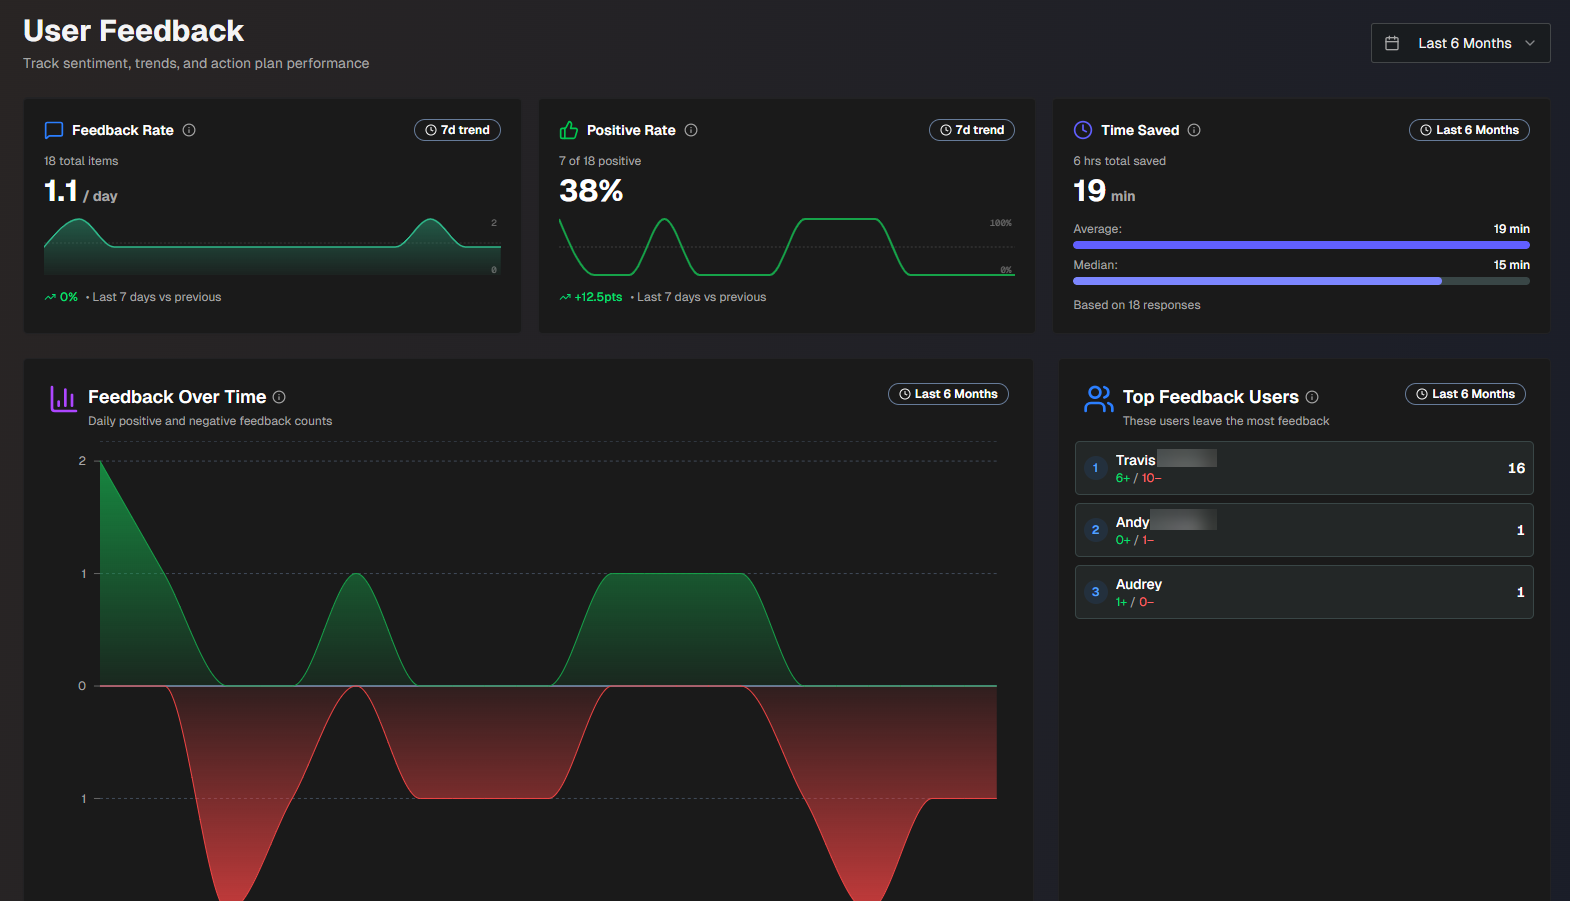
The User Feedback reports display details about the feedback your users provided on Biggy's responses. You can use these reports to see how much time Biggy is saving for your operators, and find areas where Biggy may need more context to improve responses.
Use the drop-down menu at the top right of the screen to adjust the selected time period.
User Feedback
For more information about giving Biggy feedback, see the Provide Biggy Feedback documentation.
The following report widgets are available:
Report | Description |
|---|---|
Feedback Rate | Average number of times feedback was given per day, calculated from the last 7 days of data. The percent change compares the most recent 7 day average against the previous 7 day average. |
Positive Rate | Percentage of positive feedback, calculated from the last 7 days of data. The trendline displays the daily positive feedback rate over the past 14 days. The dotted line displays the 50% threshold. |
Average Time Saved | Average amount of time in minutes saved for each query that Biggy helped with, and the median amount of time in minutes. |
Feedback Over Time | Displays the positive and negative feedback over the selected time period. The green section represents positive feedback, the red section represents negative feedback. Hover over a specific spot on the line graph to view the positive feedback rate for that day. |
Top Feedback Users | The top ten users who left the most feedback for Biggy. Displays the number of times each user has provided feedback, broken down by positive and negative ratings. |
Action Plan Performance Analysis | A chart identifying high-impact action plans, and opportunities for improvement. The X axis in the chart represents the total number of times the action plan has been used. The Y axis represents the positive feedback rate. Each circle in the chart represents an action plan. The color, size, and position of the circle show performance insights. Larger circles represent a higher amount of time saved. Red circles represent action plans with low positive feedback, Orange represents medium positive feedback, and Green represents high positive feedback. Hover over a circle to view additional details. The action plan's Usage Count, Positive Rate, Total Feedback, and Average Time Saved is displayed. Action plans in the upper left corner of the chart are Hidden Gems. They aren't used often, but receive positive feedback when they are used. Action plans in the upper right corner of the chart are High Impact. They are frequently used, and receive consistent positive feedback. Action plans in the lower left corner of the chart are Low Priority. They aren't used often, and receive negative feedback when they are. Action plans in the lower right corner of the chart Need Attention. They are used frequently, but often receive negative feedback. These action plans may need configuration updates. |
Feedback per Action Plan | A table displaying feedback grouped by action plan. The following information is displayed:
|
All User Feedback | A table displaying detailed feedback that users gave Biggy about responses to their queries. The following information is displayed:
To view the report in CSV format, click Export to CSV. |
Configuration Suggestions
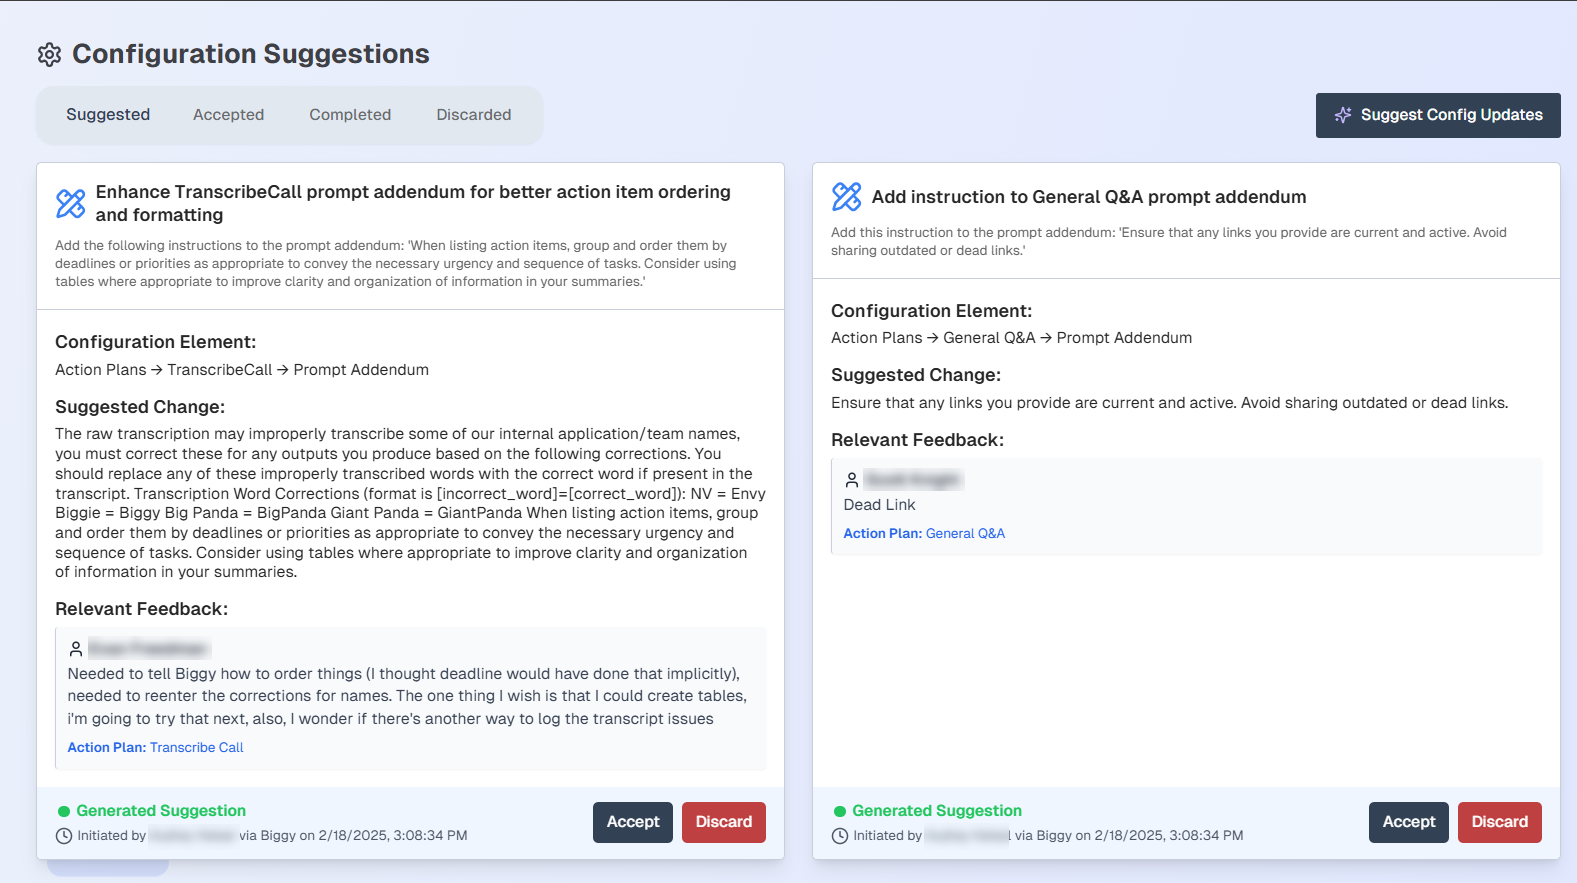
Biggy can suggest configuration changes based on user feedback. These recommendations are available in the Configuration Suggestions section.
Configuration Suggestions
Each configuration suggestion displays the following information:
Summary of the suggested changes
The affected configuration element
The full suggested change
The feedback that the suggested change is based on
The date and time the suggested change was generated, and the user who generated the suggestion.
To add the configuration change to the Accepted list, select Accept. To reject a suggestion, select Discard.
All current suggestions appear within the Suggested tab. To view suggestions you have accepted but not applied, select the Accepted tab.
Applying suggested changes
Biggy does not automatically apply suggested changes. You must copy a suggested change and apply it to the configuration element suggested by Biggy.
To view accepted suggestions that have been applied, select the Completed tab.
To view discarded suggestions, select the Discarded tab.
If no suggestions appear or if you would like to see new suggestions, select the Suggest Config Updates button.