Usage Metrics
.
Usage Metrics
The Usage Metrics section provides detailed information on how often your users interact with Biggy, which users utilize Biggy the most, and which action plans Biggy uses to answer user queries.
Use the drop-down menu at the top right of the screen to adjust the selected time period.
Usage Metrics
The following report widgets are available in the Usage Metrics section:
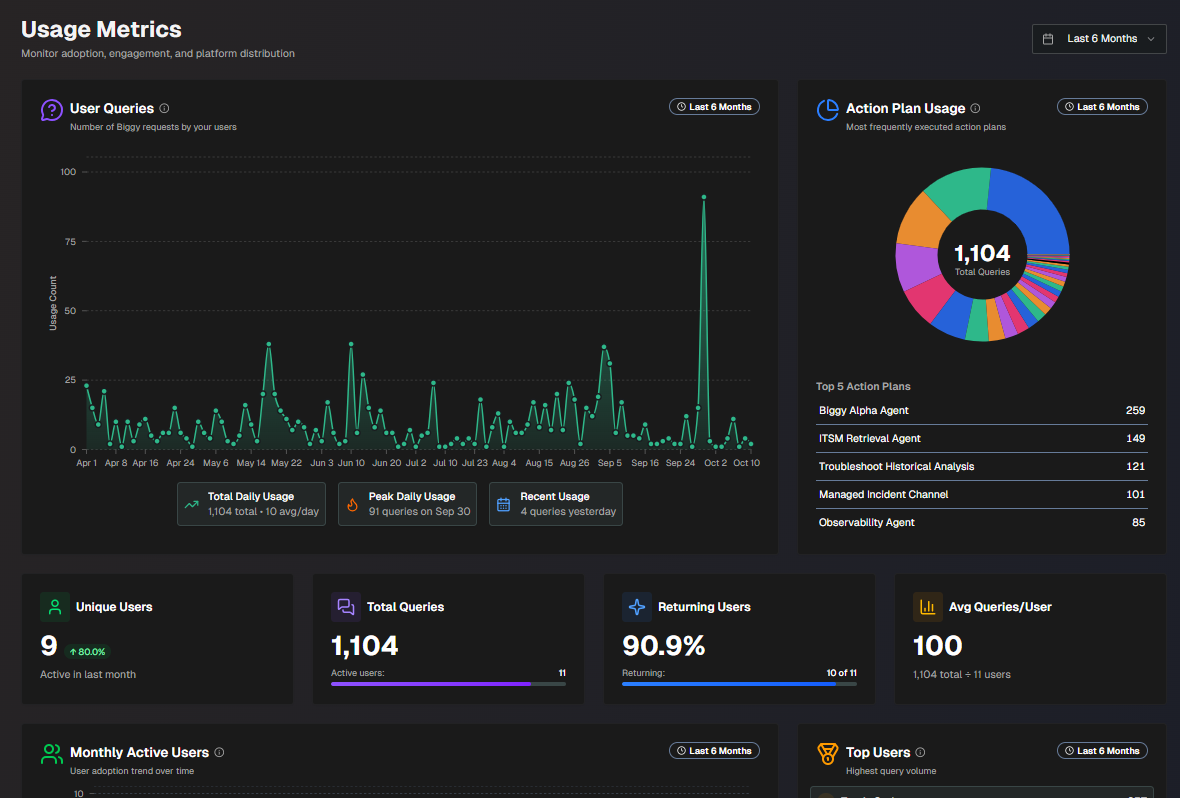
Report | Description |
|---|---|
User Queries | A line graph displaying how many times users interacted with Biggy on each day over the selected time period. On the bottom of the widget, the Total Daily Usage, Peak Daily Usage, and Recent Usage is displayed. Total Daily Usage shows the total number of queries over the selected time period, and the average number per day. Peak Daily Usage shows the day that had the highest number of queries, and the number of queries on that day. Recent Usage shows the number of queries that were executed on the previous day. |
Action Plan Usage | A pie chart displaying the number of times each action plan was used, and the top 5 most used action plans. Hover over a specific section of the pie chart to view details about that action plan, including the number of times it was used for the selected time period. |
Unique Users | The number of unique Biggy users over the past month, and the percent increase or decrease in the past month. A unique user is counted once they send a query to Biggy, either using Slack, Teams, or the web app chat. |
Total Queries | The total number of user queries and the number of active users over the selected time period. |
Returning User Rate | The percentage and number of users out of the total users who have placed more than 3 queries. |
Avg Queries/User | The average number of queries that each user executed. |
Monthly Active Users | The number of monthly active users over the selected time period, including the current month. Hover over a dot on the line chart to see the exact number of active users for that month. |
Top Users | The top 10 Biggy users for your organization based on the number of queries placed. |
Usage by Platform | The total number of user queries for each supported platform (Slack, Teams, and Web chat), and the percentage of the total for each platform. |
Web Chat Usage | A chart displaying web chat usage over the selected time period. Hover over a specific date to view the number of sessions and messages for that day. The bottom of the widget displays the total number of sessions, and the total number of messages. |
Action Plan Usage Flow | Flowing visualization of action plan adoption trends. Each colored layer represents a specific action plan. Hover over a section of the visualization to view trends for that week. The list of action plans is at the bottom of the widget. Click a plan name to highlight it in the visualization. |
User Engagement Matrix | A chart segmenting users by activity patterns and personas. The X axis in the chart represents the total number of queries. The Y axis represents the number of active days. Each circle in the chart represents a user. The color, size, and position of the circle show engagement levels. Larger circles have a higher number of queries per day. Red circles are low engagement users, Orange represents medium engagement, and Green represents high engagement. Hover over a user to view additional details. Their Total Queries, number of Active Days, Intensity (average number of queries a day), number of Action Plans Used, and how long ago they were Last Active is displayed. Users in the upper left corner of the chart are Consistent Champions. These are regular users of Biggy, but have a low number of total queries. Users in the upper right corner of the chart are Power Users. They use Biggy frequently, and with a high volume of queries. Users in the lower left corner of the chart are Casual Users. They have low levels of engagement with Biggy. Users in the lower right corner of the chart are Burst Users. They do not use Biggy frequently, but when they do, they have a high volume of queries. |
Action Plan Execution Heatmap | A heat map displaying each of your action plans, and the number of times the action plan was used for each week over the selected time period. |
Action Plan Execution Bar Chart | A bar chart displaying how many times each action plan was used for each week over the selected time period. |
Team Usage Analytics | A breakdown of Biggy usage, separated by Team. The following information is available for each team:
|
All Usage | A table displaying details about how your users are interacting with Biggy. Each line on the table displays:
You can filter usage by User or Action Plan using the drop-down menus at the top of the table. To view the report in CSV format, click Export to CSV. |