Biggy API Usage
.
Biggy API Usage
Use the Biggy API Usage analytics page to track your organization's use of the Biggy API.
Use the drop-down menu at the top right of the screen to adjust the selected time period.
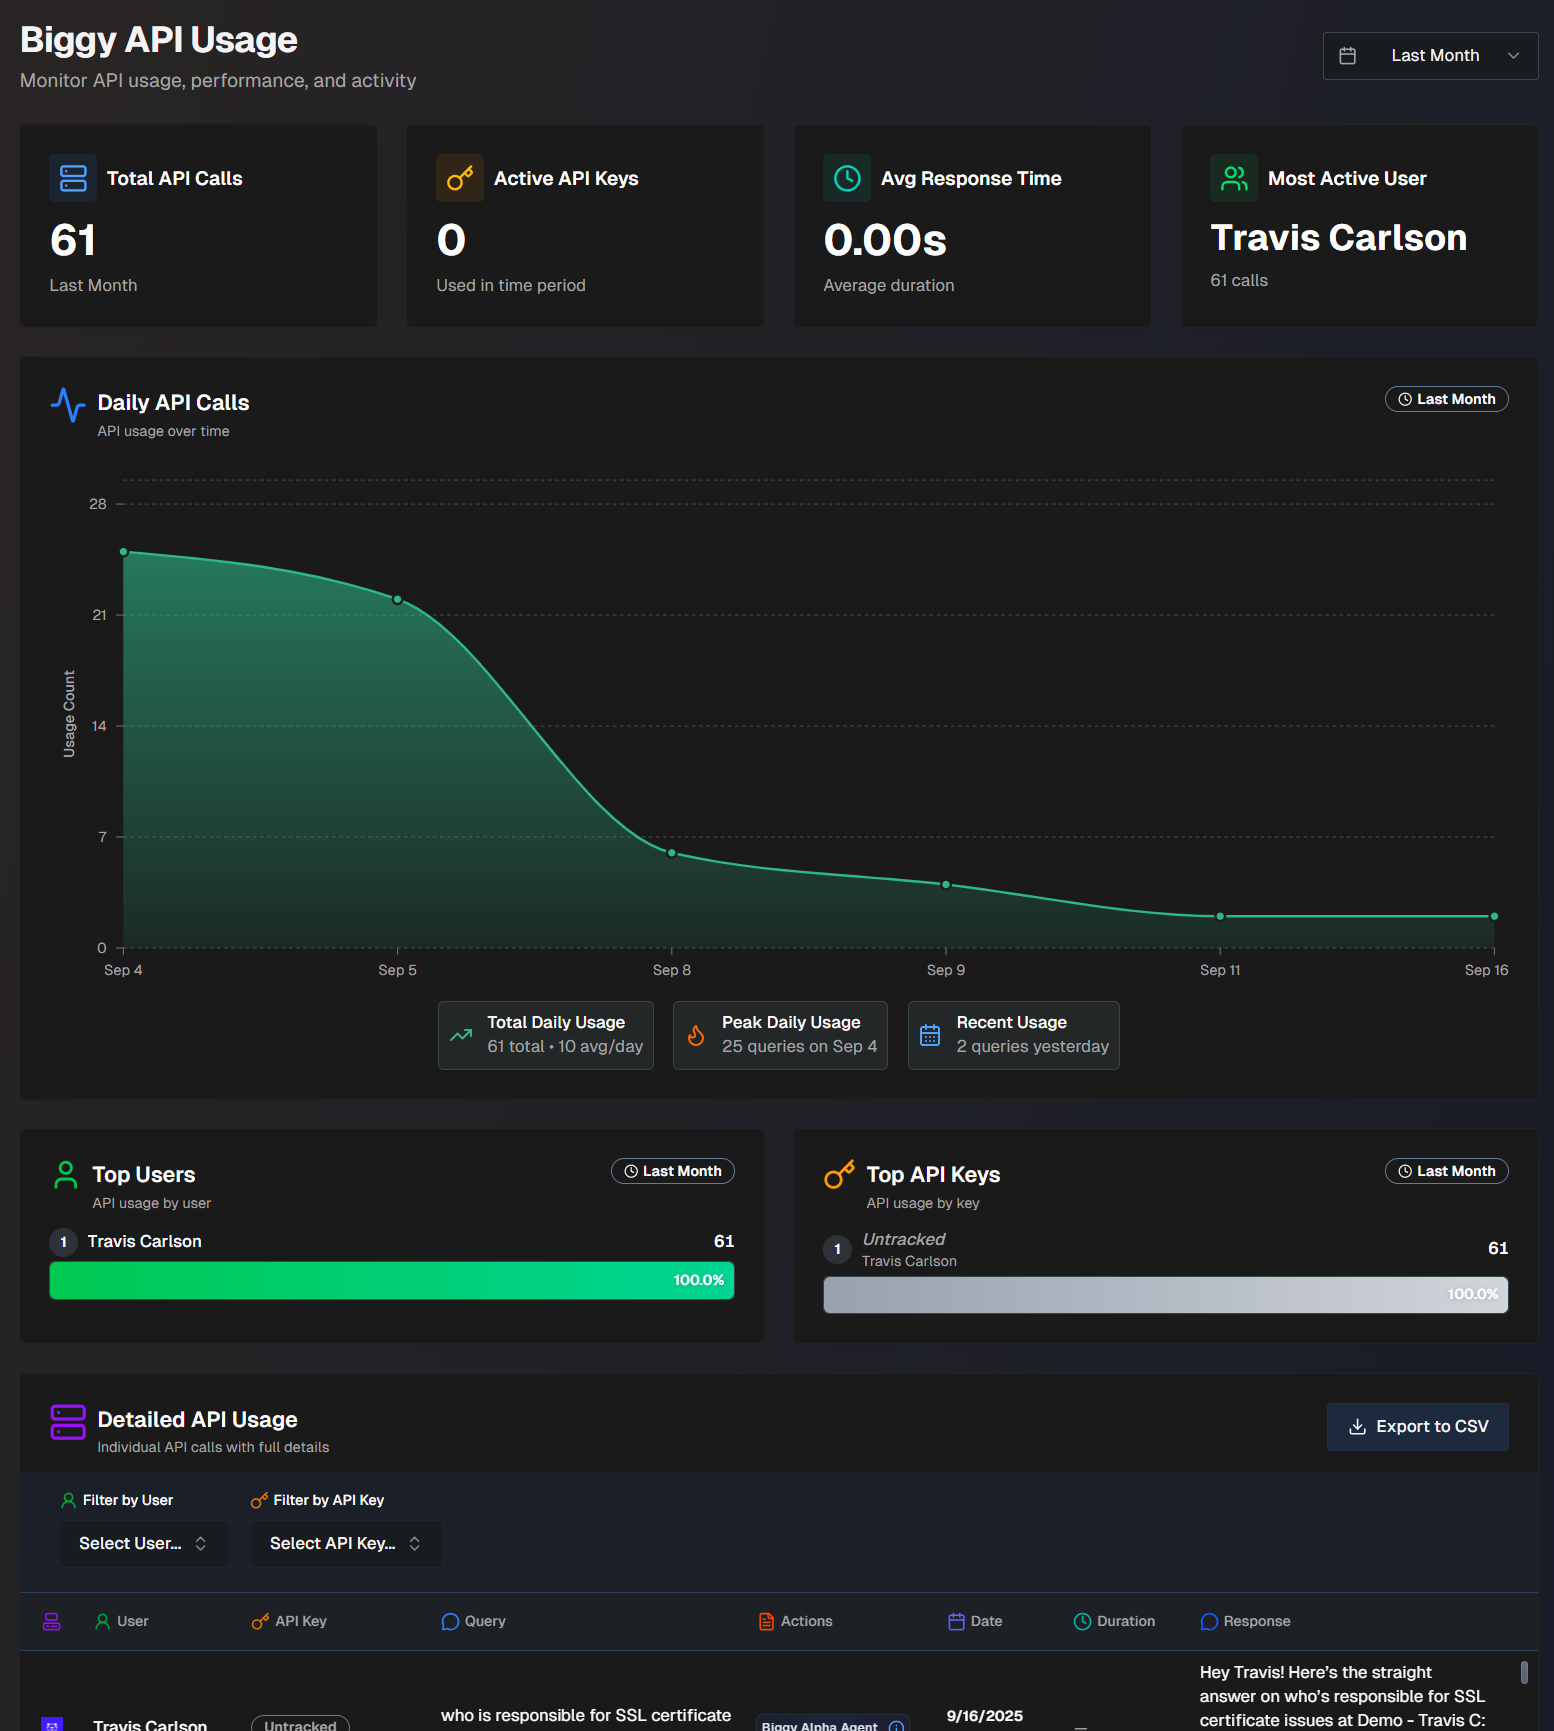
The following report widgets are available in Biggy API Usage:
Report Name | Description |
|---|---|
Total API Calls | Number of API calls made over the selected time period. |
Active API Keys | Number of active API keys that were used during the selected time period. |
Avg. Response Time | The average amount of time the API call took. |
Most Active User | The user who made the most API calls. |
Daily API Calls | Tracks daily API usage over time. Hover over a specific spot in the graph to view usage details for that day. At the bottom of the widget, the Total Daily Usage, Peak Daily Usage, and Recent Usage are displayed. Total Daily Usage shows the total number of API calls over the selected time period, and the average number per day. Peak Daily Usage shows the day that had the highest number of API calls, and the number of calls on that day. Recent Usage shows the number of API calls that happened on the previous day. |
Top Users | A list of users who have made the most API calls, and the number of calls each user made. |
Top API Keys | A list of the API keys used the most, and the number of calls each key made. |
Detailed API Usage | Detailed information about each call made to the Biggy API. The following information about each call is displayed:
|